(06/13/2018) Many people try to make their resumes stand out from all applicants. How can we do it? If you want to demonstrate your skills in data visualization, maybe you can try to use Tableau Public to build your resume, put it on the Internet and show the interactivity of Tableau's dashboard.
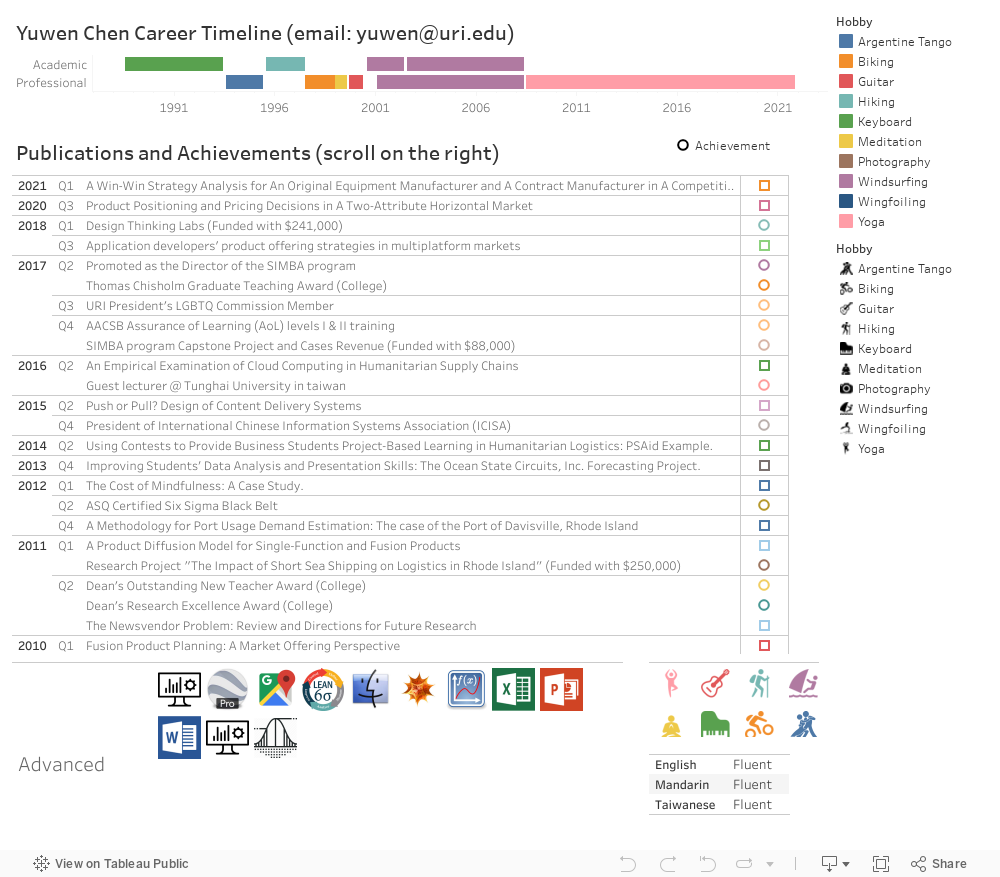
Below is an example of simple online resume that highlights my career development. You can scan the mouse through the screen (the actual online resume is bigger than the embedded screen size, so you can scroll to the right to see more) and more detailed information will pop up.
The resume above is following this Youtube video instruction. Thanks for her contribution!
(2017/08/27) It is the second day after Hurrican Harvey hit Texas. The city of Houston is shown in high water. Live traffic map tells you how the city infrastructure is paralyzed by torrential rain (when you click the link now, it will show differently from this capture image). Most sections of the highway systems show no traffic. Most communities if not in water are probably like isolated islands. There will be more rain and water to come in the following week. Pray for the city!
https://traffic.houstontranstar.org/layers/ (Houston's live traffic map)
Captured on 2017/08/27, 22:11:20.
The following picture is capture 13 minutes later from http://abc13.com/traffic/, but it seems to tell a different story. Green parts mean traffic are in good conditions (good speed). So which one is correct? Maybe BOTH. When there are not many cars (due to bad weather and many flooded areas) on the highway, the speed condition is good.
This one capture from http://abc13.com/traffic/, 13 minutes later.
(2016/09/28) This is a question circulating in the US every four years. This year the stake is more interesting: Hillary Clinton (D) vs Donald Trump (R). I found 538 has done a very good job in data visualizing. I will copy several of them and paste here. You can find the original report here.
Date: 2016/09/28
It shows the probabilities of states that is going to determine 2016 US Presidency.
This one looks like a strategy war game on my phone.
(8/6/2015) I heard this touching story of whale's singing from NPR today. I am surprised to hear that scientists use 'data analytics' to decode the song of humpback whales's singing. You will see 'visual representations' used in her methodology in decoding whales' songs. Not only that, scientist Payne found the whales' song evolved over time. "But over time, some parts of a group's song gradually change, too — in rhythm, pitch and duration — as the whales listen to each other, and together take up variations that eventually become a new tune."
(11/13/2013) When I saw this news, I wondered "WOW! This is great for data visualization." Unfortunate, it is showing how US Senate has become more polarized and more ineffective when the partisan creeped in their voting behavior. What are our principles? The party ideology?
(10/24/2013) You may wonder what is Herpes related to business? Well, not directly. But I want to show you the data visualization and the creativity of this research. "Human beings originate from Africa" theory has been speculated for a long time, and human genome research has partly shows how human migrated out of Africa. This herpes research shows another evidence of it. Well, please read it yourself. Why do they use herpes? Their research will demonstrate the creativity of this research.
What I like to show you here is the data visualization of this research. Well, if they can compile their data along the timeline and show the changes and human migration over time, that will be fantastic.
World map featuring the geographic location of the 6 HSV-1 clades with respect to human migration.
(3/26/2013) No matter which side you feel from this following figure about the casualty from US Drone strike in Pakistan, I think the group that make this figure gets what they want "shock people." I have to say, the modern HTML coding (look like java scripts, but I am not sure) makes data visualization like magics (click the news page).
This picture is not dynamic. You have to click the linked on the news page above to see how it works.